The recent rash of protests against tech workers in San Francisco appear to be the result of a number of perceived or actual grievances. One in particular, evictions, appears to be quoted often and seems to be a source of much anger. For instance, see here. I was curious as to how acute this issue actually is, so I decided to gather some data.
Eviction notice data can be gathered from the San Francisco Rent Board. While the raw numbers are interesting, I wanted to know the numbers in relation to the population of San Francisco, as well as the number of occupied rental housing units.
The SF Rent Board annual data cover the year from March to February of the next year. Data for 2013-2014 is partial. It only covers the year until December 2013. It was compiled from SFRB’s monthly reports. I used the partial data to project for a full 2013-2014 period.

The first thing to note is that total eviction notices are down. A few years ago they reached nearly half what they were back in 1997-1999, near the hight of the dot-com bubble, and for the 2013-2014 period they are projected to to be a third lower.
You’ll also notice an upswing in 2012-2013. That upswing is largely the result of an exceptional event. A special deal brokered by then supervisor and uber-progressive Chris Daley to enable the Trinity Apartments complex to re-build rent controlled units. That section of the eviction law is not generally applicable to any other units and all those tenants were offered new units in the new building built at the same site.
But you also see an upswing after 2013-2013 that is not attributable to the Trinity Apartments deal. One component of this upswing is eviction notices filed as a result of breach of rental agreements. These notices have reached record levels (for 2013-2014 507 [partial] and 608 [projected]). There has also been an increase in owner/relative move-in and demolish or remove from housing use notices.
And as you can see, the usual bogeyman of eviction protesters, Ellis evictions, have increased recently. Such evictions skyrocketed during the dot-com peak, then came down after the crash, increased somewhat again during the real estate bubble, crashed when the economy tanked, and increased again recently, but they still below the highs of the housing bubble (2004-2007) and the dot-com bubble (1999-2001).
The most real eviction threat appears to be owner/relative move-in evictions. There are more such eviction notices than for Ellis evictions every year, except for the period 2006-2009. There were massive amounts of such evictions during the 1997-2002 period. But these have come down significantly in number from their peak during the dot-com bubble.
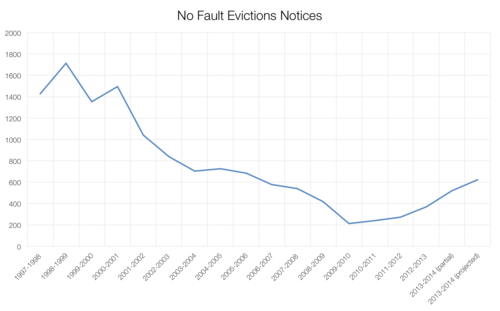
The second chart shows the number of no fault (Ellis, owner/relative move-in, demolition, capital improvements or substantial rehabilitation) eviction notices. These are increasing having hit bottom during the financial crisis, but are still far below their peak during the dot-com bubble.
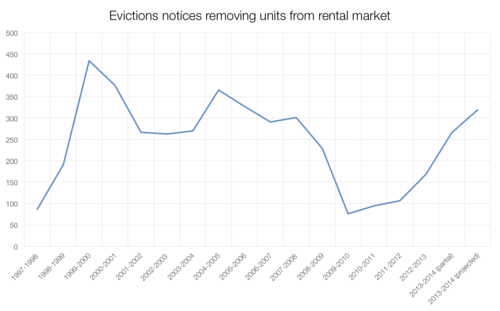
The third chart shows the total eviction notices for evictions that removal units from the rental market. These are composed of condo conversion sales, evictions to demolish or remove the unit from housing use, and Ellis evictions. Condo conversion evictions are minimal, usually in the single digits, although they have increased in the past two years. Demolishing or removal from housing use has been pretty steady for the past seven years, except for a slow down during the financial crisis and a slight increase recently. So what you end up is with more or less an Ellis chart.

The fourth chart shows the number of eviction notices as a percentage of the population of San Francisco and as a percentage of the number of occupied rental units.
The population numbers and number of occupied rental units comes from the US Census Bureau. The population percentage is adjusted by multiplying the percentage by the average household size of renter occupied units as determined by the Bureau for the year 2012 (the latest available). The Bureau only generated yearly estimates of occupied rental units from 2005 onward. Before that the estimate was only available during census years. Thus, the data is disjointed, with a lonely data point for the 2000 census. The data for the last 2013 is not available from the Bureau, so I’ve projected linearly the population and number of occupied units based on the previous 5 years of data.
Both series show the same pattern. The percentages of evictions have come down significantly from the highs during the dot-com bubble. There was a dip during the aftermath of the financial crisis and has edged somewhat higher recently, but is still within the normal range.
To summarize: The data appear to indicate that, while there has been an uptick of evictions lately, there is no eviction crisis in San Francisco.
———
What of other protester grievances?
There seems to be no denying that rental rates have soared during the past few years, pricing out many folks out of the San Francisco rental market. Many news stories have been written about the price increases across the city and how San Francisco has become one of the most expensive cities in the country to live in.
That said, non-anecdotal rental data is somewhat harder to come by. The St. Louis Fed FRED system will easily generate such chart based on the Bureau of Labor Statistics Consumer Price Index surveys, but it groups the San Francisco market with the rest of the Bay Area.
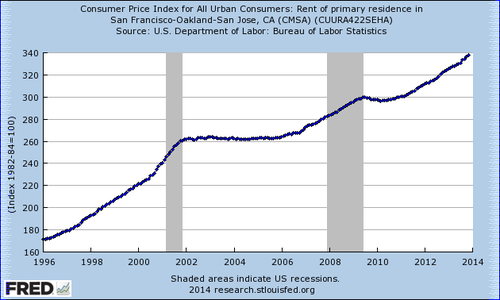
Limited as it is, the chart shows the increase in rents that occurred during the dot-com bubble, followed by a period of stable rents after the bubble collapse and the ensuring recession, then an increase again during the real estate boom, with a short slowdown during the financial meltdown, that was soon overtaken by the current rent increases. By now rents in the Bay Area have increased nearly as much from the start of the real estate bubble (2006) until today nearly as much as they increased during the dot-com boom.
We can find some San Francisco specific data from RealFact via the SF Office of the Controller in the form of time series of weighted average of the asking rent. It tells the same story as the FRED chart.

So why are rents to high? Demand.
Since 2000, San Francisco’s population has grown by more than forty-two thousand individuals. The 2010 Census tells us that 64.2% of housing units are renter-occupied. If we assume this percentage also applies to individuals (its actually lower, since the average occupancy if higher in non-rental units, but we’ll ignore that for our purposes), then we needed about 27,000 additional rental units to absorb the population increase. Yet, the Bureau tells us that there are only 7,794 additional rental units occupied today. That is a gap of nearly 20,000 rental units, or about 9% more than the current occupied rental units.
In addition, consider that as of March 2013 603,799 people were employed in San Francisco, a number that has been steadily increasing during the past 4 years. A substantial portion of these folks live outside San Francisco. It is safe to assume that a not insignificant portion of these folks would like to live in SF, if for no other reason that to shorten their commute.
So there is a lack of rental units to keep up with both the existing population growth and the folks that would like to move in the city. Basic microeconomics tells us this high demand and low supply is the reason for the astronomical rents.
The protesters’ animosity comes from the perception that it is technology companies that have either grown in the city or moved to it during this latest tech boom, that are the source of the increased population pressure here, with the added insult that tech workers are seen as being better paid, and thus being able to outcompete other residents for the limited supply of rental units.
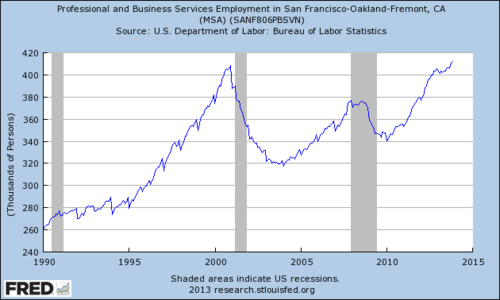
While high profile events, such as Twitter and other tech companies moving to mid-market and expanding make this a reasonable assumption, employment data is somewhat muddled, making it difficult to clearly backs the assumptions. The BLS employment data for the SF-OAK-Freamont metro area for information employment sector, which includes software publishing, telecommunications, Web search portals, data processing industries and information services industries does not show a pike like it did during the dot-com boom.
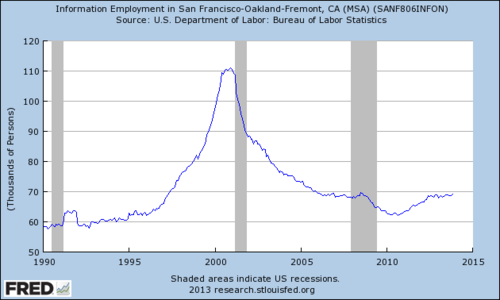
It could be the latest tech workers are being classified under the Professional and Business Services employment sector, which has seen a spike recently, like it did back in the 90s. Alas, that category encompasses many professions, in addition to those under Computer System Design and Scientific Research and Development. And in both cases the data includes a geographic area larger than San Francisco.
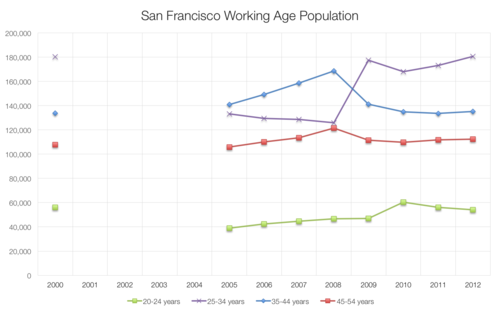
That said, recent yearly estimates do indicate that the population in San Francisco within the 25 to 34 year cohort has increased significantly (35%) during the past 7 years, which corresponds to with apparent increase of tech workers in the city. Their number are now as high as they were during the dot-com boom.
Its also true that tech workers are highly paid in relation to other careers in the San Francisco-Oakland-Fremont metropolitan area. Although there are more highly paid professions (management, legal, and healthcare occupations) with nearly as many practitioners, the conspicuous recent increase in the number of tech workers make them an easy target.
So what is the solution?
There is an argument to be made for rent control, although it can also be argued that rent control makes the problem worse. Either way, rent control, even if effective, can only slow down the increases, as landlords are free to increase the rent as much as desired once a tenant leaves and the unit comes to the market again.
Unless we are willing to impose control not just of the increase in rents during a tenancy, but also when a unit goes on the market (i.e. full price controls), then the only real solution is to increase the supply of rental units. The city cannot impose restrictions on whom choose to live here (so as to reduce demand) and I assume we do not wish for a bad economy.
Alas, at the rate the city is building new units, it will take more 20 years just to fill the rental unit gap we have today. The following chart at the Controller’s web site shows the 12-month moving average for total units in buildings with new contraction permits.
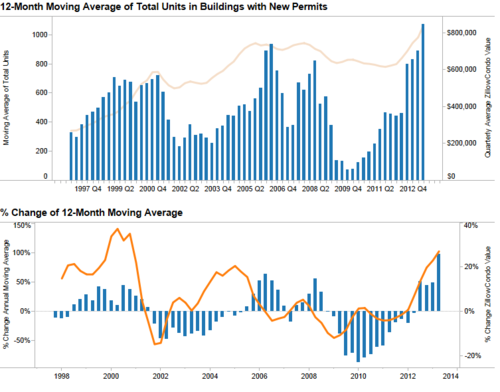
Note that the 12-month average as of now is just 1,073 units, that this is the highest it’s ever been, that only a portion of these units will be rentals rather than for sale, and that this number if but a small portion of the number of rental units needed in the city to balance supply with demand.
In the end, tech works are simply a convenient straw man for folks to direct their anger are high rents, which are simply the result of a strong economy, the anti-development history of San Francisco, the city’s limited geography, and market forces. In a slightly different scenario, the vilified workers could have been in biotech, aerospace, or finance. So long as the local economy is strong, San Francisco is a desirable place to live in, and the population increases, rents, like real estate, will go up in San Francisco. At best, we can slow down these market forces and provide a helping hand to those less fortunate to ensure they have some support dealing with these changes.
dualcitysf liked this
tylerhwillis reblogged this from elias-levy and added:
Good data on some of the civic issues SF is facing. I think the author has draws too charitable a conclusion at the very...
ellipsisandetc reblogged this from elias-levy and added:
Useful and interesting analysis of eviction rates and rental prices in SF. We need more supply. That’s not a surprise,...
 fundgruber liked this
  elias-levy posted this