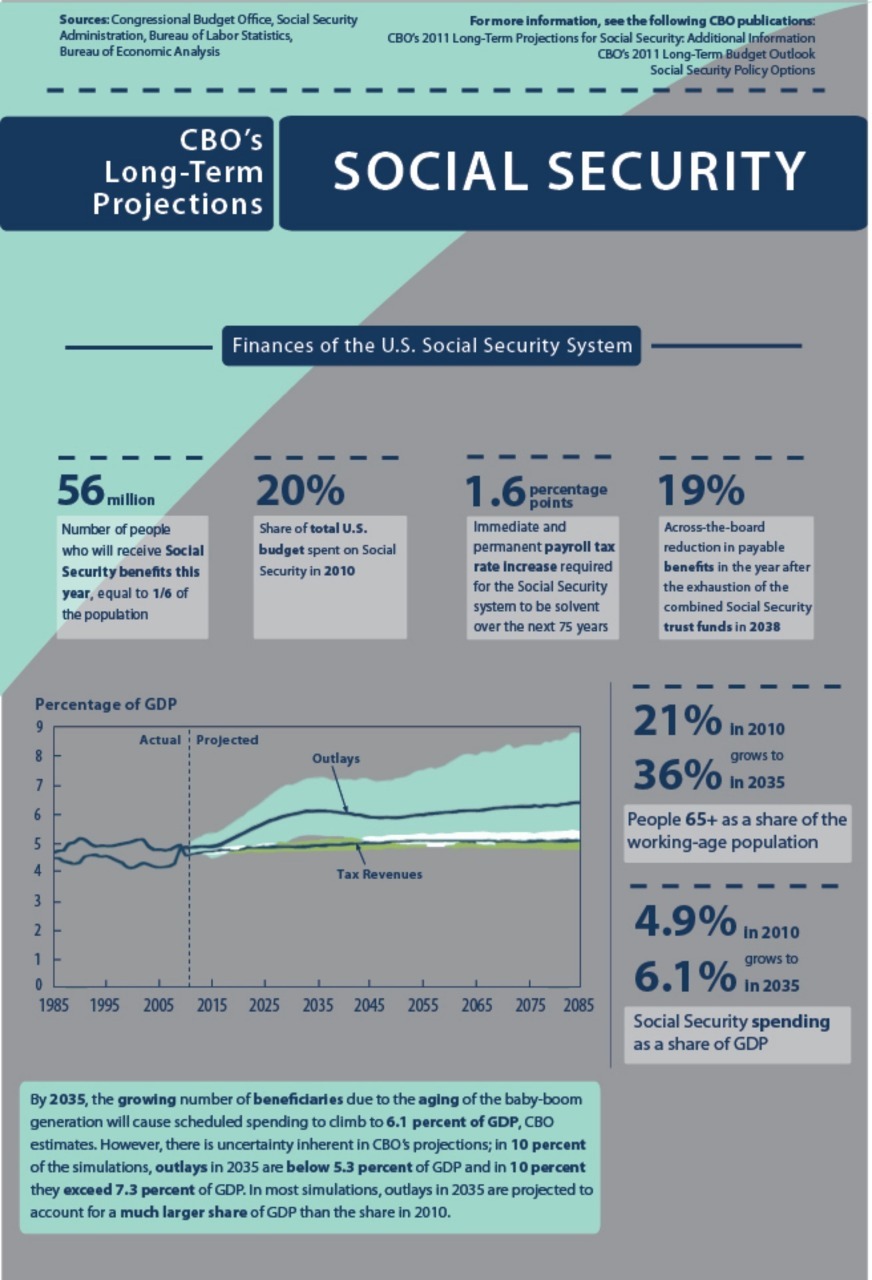
The Congressional Budget Office’s whole chart on Social Security is massive, but we’ve cut out a few choice bits here. What’s the take away? Here are a few:
- Something’s got to give. As the number of workers supporting every person drawing on social security declines precipitously over the next quarter century, a (relatively) smaller group of individuals is going to be supporting an ever-larger group of recipients. Which influences…
- Tax rates. To get Social Security to 75 years of solvency, the US would need to bump up the current payroll tax by 1.6 percentage points. That would take the rate from 12.4 percent (half paid by the employee, half by the employer) to 14 percent. That would stave off…
- A nearly 20 percent reduction in benefits in 2038 if the Social Security trust fund is exhausted at that time, as the CBO projects.
- Finally, Social Security could continue apace through 2038. As America has seen in the last 27 years (taking us back to the presidency of Ronald Reagan), plenty can change in almost three decades.
Take action: Find out your own estimated Social Security benefits using the Social Security administration’s handy calculator.
