Time Ranges Done Right: Fixing a Common Analytics Plot Hole
It can takes customers weeks to complete a purchase cycle. How does your analytics product handle that?
The Epidemic
It’s no secret that web metrics, analytics, measurement and optimization products have been much the rage as of late in the technology and marketing communities. Recently we’ve seen promising startups gain traction, and large companies in this area exit to even larger companies. It’s terrific to see that measurement and optimization really seems to be gaining a foothold across many user groups, not just early adopters or metrics specialists.
Here’s the problem
Essentially every report in any analytics product starts with a time range. Many products are still handling the presentation of time ranges incorrectly. What this means is that users of these products are tying cause and effect together erroneously.

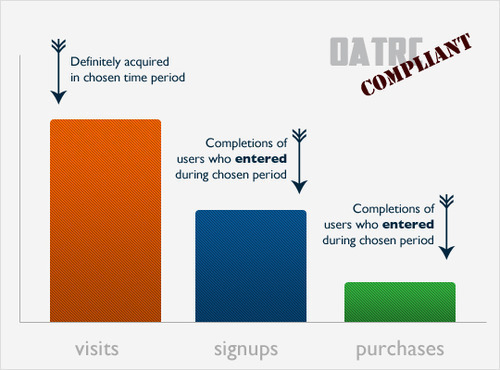
A simple example: imagine a report showing the performance for the last 30 days of a multi-stage funnel. You see the total number of people who entered the funnel, then of course the number of people who made it to the next stage of the funnel, and then perhaps the number of people who completed the goal at the end - maybe a purchase. Here is the plot hole with many products out there: they show total completions for that time period, regardless of when people entered the funnel.
What if the second stage of the funnel was a signup, and the final stage was a purchase that is typically triggered by a follow-up email stream that takes 3 weeks to complete before presenting the offer?, I am intentionally picking one of the most common multi-stage marketing patterns on Earth to illustrate my point.
What this means is that effectively you are looking at the acquisition and initial conversion for one time period, and the conversion of another. You got 10,000 new leads this month, and 100 of your leads from god-knows-when happened to convert in that period. This is simply an incorrect way to present the data.
Product Comparison: Big Green vs. Big Orange
AdWords gets this right. Why? Because it would be extremely foolish if AdWords did not present the data to paying customers ‘correctly.’ The AdWords case illustrates the point beautifully: the buyer of advertisements must have visibility into the performance of that spend. So for any spend period, the remote conversion metrics must tie to spend directly to show ROI. It is absolutely mission critical to be able to see dollars-out vs. dollars-in for any given day of spend, so the conversion count (and value) appears in-line next to the spend. If you buy an ad one day, and a visitor who clicked on that ad ends up buying a month later, that conversion *must* be attributed correctly.
Now, there is a very common web analytics product whose name I won’t mention that falls into the (common) trap of incorrect time ranges for multi-stage goal completion. There is no way to see the eventual conversion rate through multiple stages for a set of visitors who entered within aspecified time range. All you can see is volume by step for a time range, as well as the calculated conversion percentage based on division of total volume between steps. What happens if a user hits a landing page, then returns a month later to purchase? There really is no intuitive way to track this case in this product.
Other products
I will not go into a detailed analysis of who is doing this right and who is doing this wrong.
I know that there are products that do it right, some that do it wrong, some that have made the shift from the wrong way to the right way, and some that plan to do so. If vendors are interested in discussing their approach to time range data selection in the comments, I encourage the discussion.
The Solution
Ladies and gentlemen, I present to you the Open Analytics Time Range Charter (OATRC). I present this charter into the public domain. Please take this, use it, improve on it, blog about it, complainabout it, and bring this conversation to the fore in the analytics community.

Multi-stage conversion reports must display data based on 'time entered’
For any report which selects data for display based on a time range (start day, and end day), the data presented must represent the goal completion behavior for users who first entered the multi-stage conversion funnel during specified time period. This is most easily accomplished by performing an initial query for all uniquely identifiable visitors, and then retrieving the conversion performance data for each stage, for specifically this group of visitors.
Multi-stage conversion reports may have two types of time range selection
In addition to 'time entered,’ the data display may offer an additional type of time range selection, 'time completed.’ When used, 'time completed’ will require that the data displayed for each conversion step represent the total volume of step completions for the specified time range.
Multi-stage conversion reports may offer 'unique’ vs. 'total’ filters for all reports
In some cases it is beneficial for report viewers to compare the total occurrences against the unique occurrences (by cookied visitor). It is encouraged to offer both options to the report viewing user, and it is at a minimum required to display to the user which approach the application is taking, regardless of whether the user has a choice of configuration.
Example
The real work to be done here is of course not on the client side, but here is a suggestion for how to expose this OATRC functionality in your UI:

Compliance
I will certify analytics products as being OATRC compliant in exchange for a donation to the MMMF (Markitecht Multiple Maserati Fund).
13 notes
gregorynicholas liked this
 explicitbunc-blog liked this
 - missy-molette1-blog-blog liked this
bokardo liked this
markitecht posted this