10
Jan
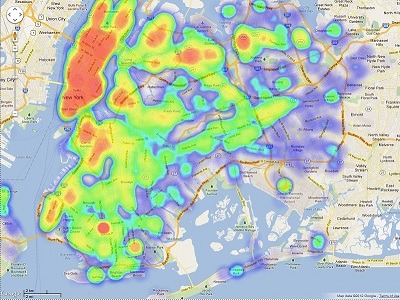
Heatmap of Restaurants in New York City
Two things I like are data and food. The two rarely mix, unless you do something stupid like create a heatmap of restaurant density in New York City. Which is exactly what I did. Without further ado, here it is:
Brooklyn, Queens, Manhattan
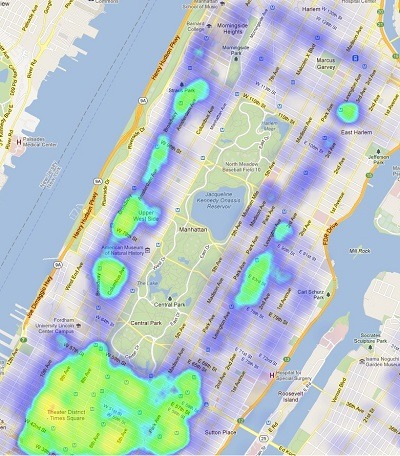
Upper Manhattan
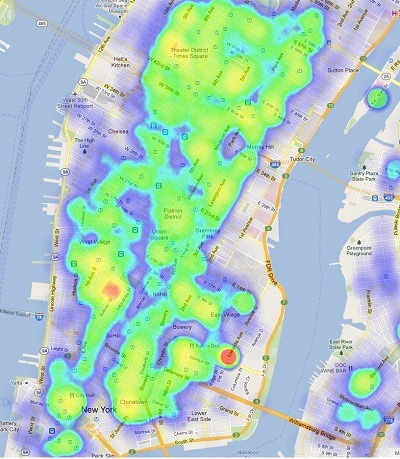
Downtown Manhattan
If you find this chart tasty, then try calling back for reservations over the next few days. The raw data set from NYC OpenData includes restaurant inspection grades and cuisine types, so consider this just the appetizer.
Lots of attributions here, since putting this together was like making Frankenstein. Restaurant addresses, of course, came from NYC OpenData's Restaurant Inspection Results. Geocoding the raw addresses turned out to be harder than I expected, but it was nothing Excel/VBA (don’t judge) and Yahoo! PlaceFinder couldn’t solve. In order to generate the heatmaps, I used the Google Maps API and, most crucially, a JS heatmap library from Patrick Wied. Phew.
 pitcherplant reblogged this from dfkoz
 brooklyner reblogged this from nycopendata
jasminefowlkes liked this
nycedc liked this
johnesperanza-blog liked this
nycdigital-blog reblogged this from nycopendata
nycopendata reblogged this from dfkoz and added:
Check out these NYC restaurant heatmaps created by dfkoz using the NYC OpenData “Restaurant Inspection Results”
dfkoz posted this