19
Jan
Cuisine Concentration in New York City
To cap off a recent series of posts on New York restaurants (see What’s the Safest Food in New York City? and Heatmap of Restaurants in New York City), I put together heatmaps of restaurant density by cuisine type.
Only one comment before we get started: I have no idea how the DOHMH categorizes restaurants. There are, for example, categories for Chinese, Japanese, Chinese/Japanese, and Asian. With that said, here we go:
American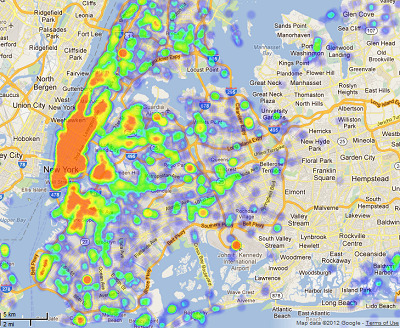
Asian
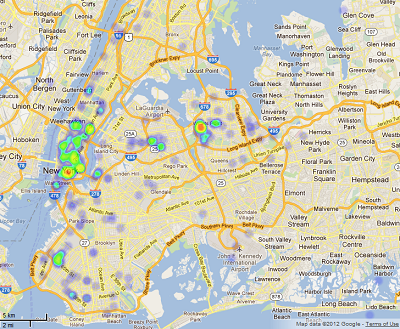
Bakery
Caribbean
Chicken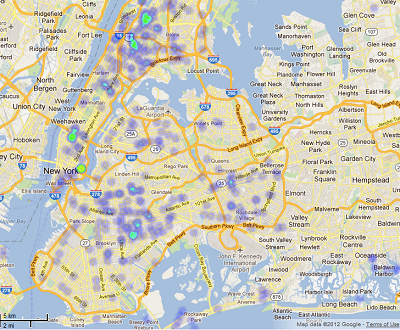
Chinese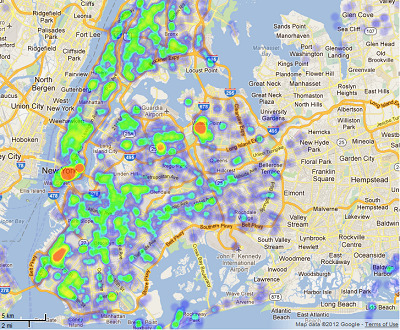
Deli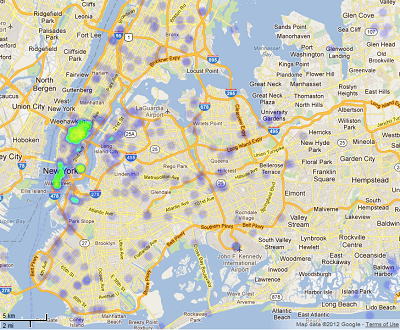
Hamburgers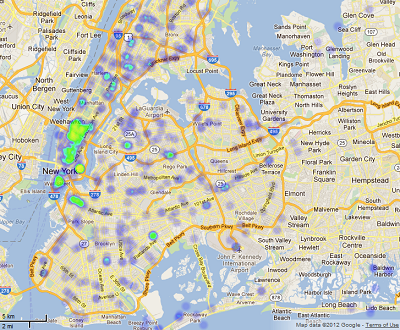
Indian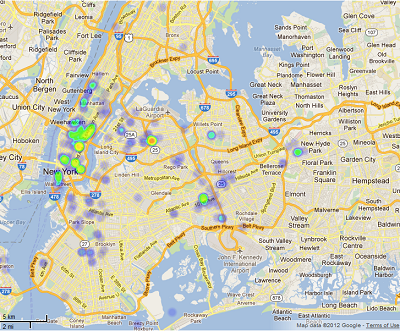
Italian

Japanese

Jewish/Kosher
Korean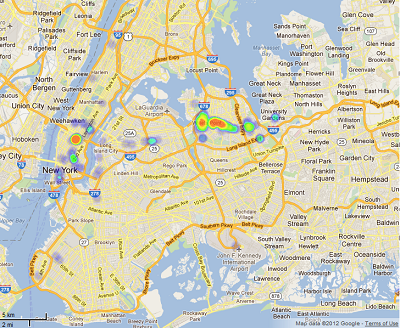
Latin
Mexican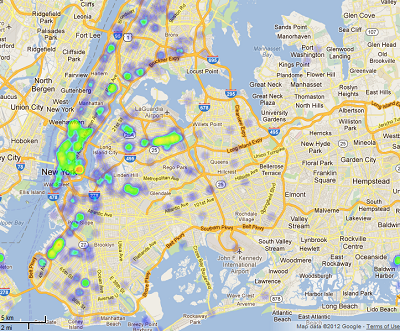
Pizza
Spanish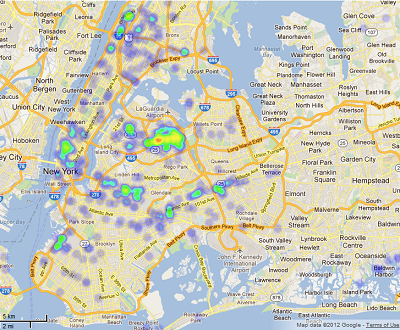
Thai
Once again, some thanks are in order. Restaurant addresses and cuisines came from NYC OpenData’s Restaurant Inspection Results. Geocoding the raw addresses was done with Excel/VBA (don’t judge) and Yahoo! PlaceFinder. The heatmaps were generated with the Google Maps API and a JS heatmap library from Patrick Wied.
That’s it for restaurants. For the next few posts, I’m going to turn to a different data set altogether. Suggestions welcome.
chelseabnyc liked this
cityscape-newmedia reblogged this from dfkoz
scheepvaartboeken-blog reblogged this from radioon
setecq liked this
mildredbod8-blog liked this
dfkoz posted this
- Show more notes