Spillover numbers and inventory reduction discrepancy
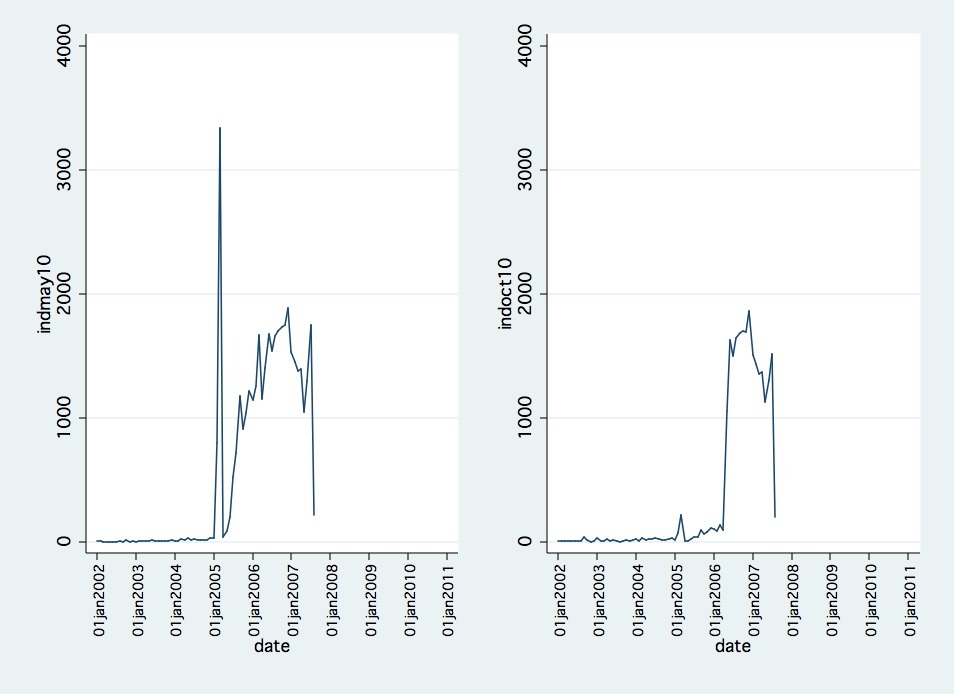
Frog says: I have been wondering why the spillover numbers do not match the number of pending cases eliminated that I see in the graph. The clue is in the graph itself. The EB2 visas are always being given throughout the year and yet the graphs show only extremely minute flucuations during most of the year. Only when spillover is applied it contorts massively. Therefore the lower number of clearance must mean that spillover + actual allocated visas were consumed by those who were not in the line at all. My previous posts show that Dec'09, Mar'10 and May'10 visa reports contain data for EB2 India that have not dissolved a bit. Therefore during the previous 10 months and even after the spillover, it looks like 2800 + ~700 visas were consumed by mysterious claimants. Are they the EB3 to EB2 porting individuals? If so then there are ~3500 individuals in FY10 during the dates we are looking at (Oct'09 to Sep'10). And this is for India alone. Will attempt to combine the data for China as well in the next post. However, the total visa allocation for China and India is 5600 and I expect the porting cases to be approximately around that figure or less as cutoff dates for India did not move in the first three quarters and China’s dates moved at the least by 5-15 days a month.
References: As in the prior posts.
papyh posted this