“ALEC has been publishing its index since 2007. The obvious question, then, is: How well do the outlook rankings predict state economic performance since 2007? Rather than focus on the best and worst eight or ten states, as Rich States, Poor States is wont to do, we consider all 50 states, ranked from 1 as least competitive according to the 2007 index to 50 for the most competitive. We will look at scatter plots showing the state’s ALEC rank versus growth on various economic performance measures so that a trend line fitted to the data shows by its steepness whether higher-ranked states do better or worse on a particular measure. The five performance measures illustrated—non-farm employment, per capita personal income, population growth, state Gross Domestic Product (GDP), and state revenue—are the principal ones relied on by ALEC in its Economic Performance Ranking and in its discussions of state performance throughout its report.
As the charts below show, the ALEC Outlook Ranking fails to predict economic performance on four key measures of growth. On the horizontal axis, the states are arrayed according to their ALEC ranking, from the “worst” state at position 1 to the “best” state at number 50. The vertical axis shows where each state fell on some measure of economic performance. If the ALEC outlook ranking worked as advertised, the trend line shown in each graph would slope up and to the right: the better a state’s ranking, the better the performance. The correlation would be positive and significantly greater than zero (the maximum possible being a value of 1.0, which would be a perfect correlation).
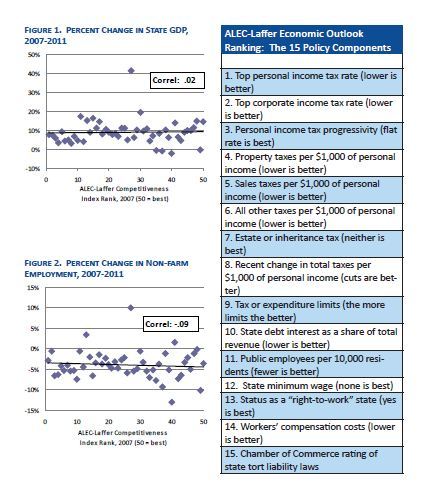
Let’s look first at a key measure of economic growth: change in state GDP. As Figure 1 shows, there is virtually no relationship between the ranking in 2007 and a state’s five-year rate of growth in GDP; the correlation is insignificant at 0.02, almost zero. The states are all over the place, and there is no tendency for better ranked states to do any better or any worse than lower ranked states.
Next, consider the growth in non-farm employment, shown in Figure 2. Here the correlation is slightly stronger, but actually negative (-0.09): in other words, the higher a state was ranked on the A-L Index in 2007 the worse its job creation record over the next five years.” – Peter Fisher, Greg LeRoy and Philip Mattera, Selling Snake Oil to the States: The American Legislative Exchange Council’s Flawed Prescriptions for Prosperity
teddytutson posted this