The Decline of IE and Firefox
Windows and IE are dying under the assault of iPads and other tablets from the left, and Chromebooks from the right. This is not surprising, or even news to people who spend a lot of time in the tech world. What surprised me recently was how precipitous the decline of Internet Explorer has been in the past few months.
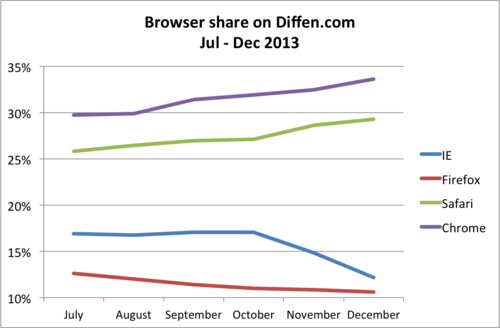
(update: some comments on Hacker News questioned why the y-axis on this graph doesn’t go from 0 to 100. Browser shares tend to move slowly. All 4 lines will appear essentially flat if I did that. The story would be lost. This type of chart with a short range for the y-axis is the best way to depict browser share.)
Flashback to summer of 2012 when IE’s share of traffic to Diffen was a little over 26%. This was for n= ~ 1 million visitors. Fast-forward to December 2013 where IE’s share has dropped to 12.17% (n = ~ 4 million visitors). Diffen is a consumer-oriented website with over 60% traffic from the U.S. So yes, this is probably not a true reflection of worldwide market share. But boy is there a decline in Q4!
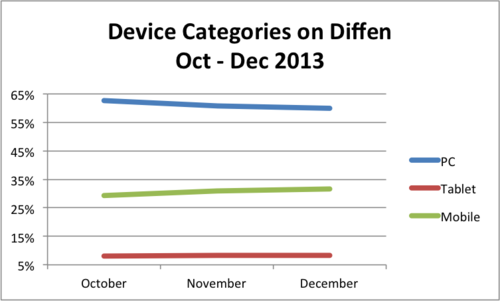
And all of it cannot be blamed on the decline of Windoze or PCs. Windows users still accounted for 47% of traffic in December. And Desktops accounted for 60% of all traffic. The share of mobile traffic jumped from 29 in October to 32% in December.
Also notable is the slow but steady decline of Firefox. They’ve been doing some really cool stuff with asm.js and PDF.js but this does not seem to be translating into any gains in mainstream market share.
The good news in all of this is – you guessed it – no need to support IE < 8 ! Here’s how IE’s 12.17% share in December breaks down into all its versions:

(update: in response to Christian Jensen’s request in the comments below, I have translated these numbers into % of total market share in this chart:)
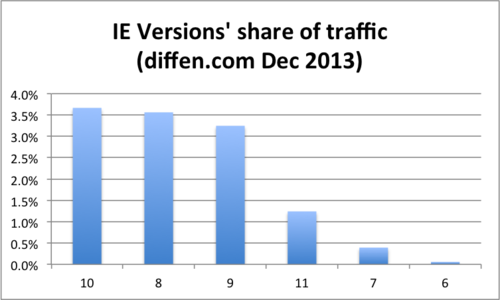
Of course, I’d prefer to not have to deal with IE 8 either but at least right now its share is material.
Disclaimer: Once again, these numbers do not reflect the state of the web. There are many other sources of browser share statistics that are based on more data and offer more granularity for your research. If you already have a web presence, look into Google Analytics for data on your audience. If you’re working on a startup in the consumer space, expecting visitors mostly from the U.S., Canada, UK, and about a third of them from their smartphones, then these number might be more relevant to you.
Bonus tip: If you have goals set up in Google Analytics, create a custom report to see conversion rates by browser and by screen resolution. This can potentially uncover problems where certain segments of your visitors aren’t converting because the site is not working for them the way you expected. (Hat tip: @CalebWhitemore)
1 Notes/ Hide
sduncombe liked this
 thediffenblog posted this