Defining Structured Support and Resistance
Occasionally I make a reference to structured support and resistance, implying a distinction between this and more basic forms of S&R such as horizontal price levels and - just as simple, but more slippery in execution - diagonal levels (such as what you’ll encounter in a triangle/pennant/wedge or up/down channel).
What makes up the distinction?
Structured S&R always involves confluence, or the meeting/overlap of multiple technical features at an intersection of price and time. What this may involve is wide open: candlestick patterns, trend lines, moving averages, pivot points, fibonacci levels (time or price), technical overlays like Ichimoku, momentum indicators, etc. Of these, I use fibonacci almost exclusively but will consider other features if they appear relevant.
One implication of the primary use of fibonacci: Structured S&R refers to a complex of support and resistance.
First: trends occur in a broader context. Where a trend moving begins, major swing highs and swing lows precede it, giving whatever occurs next a sense of scale and perspective. These defining levels are often complemented by what follows them through time and price measurement and symmetry. Because of this they can and do figure heavily in the structure of a trend.
Second: In the course of a trend, the secondary corrections and pullbacks/throwbacks that occur throw off simple levels of support and resistance. These counter-trend turns don’t exhibit theoretical precision as a rule, but often complement the trend’s larger context (above) and create a micro-context of their own. With successive ups and downs, a trend emerges: made up of impulsive and corrective moves that that roll over and bounce off at specific and familiar measurements.
Taking these macro and micro contexts together, the retracements, extensions and projections that emerge in a trend begin to solidify as specific price and time locations repeatedly come up, plotted in the future. Those levels that come up most often are a kind of “inductive conclusion” given off by the market’s context - in other words, this or that price area or window of time is the entire trend’s statement on the levels that matter next. The symmetry, disparity and complementarity of the measurements yielded by the features before and during the trend each chip in their input, creating a complex that points ahead to specific levels - a structure. Where the structure harmonizes best are the locations where structured support or structured resistance occur.
Structured S&R is possible to derive from any market liquid enough to trend. It is possible on any time frame and instrument. These levels are highly valuable because they usually activate a consolidation, creating continuation setups; or simply reverse. As you’d expect, the higher the number of inputs, the greater the complex, the longer the period of time that elapses over the structure yields a more significant technical projection.
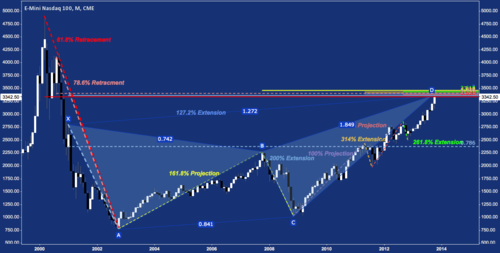
An excellent example of Structured S&R is this chart of the NASDAQ 100 from last week. Many fibonacci studies are plotted here creating a massive cluster between 3350-3450. You can see how the retracement, extension and projection levels of trends long-past combine to not just create cluster resistance but spell out the anatomy of the 10-year bearish harmonic Butterfly (blue rectangles) pattern present on NQ (no position).
seeitmarket reblogged this from andrewunknown and added:
A solid post by fellow See It Market contributor Andrew Kassen distinguishing between basic support and resistance and...
andrewunknown posted this